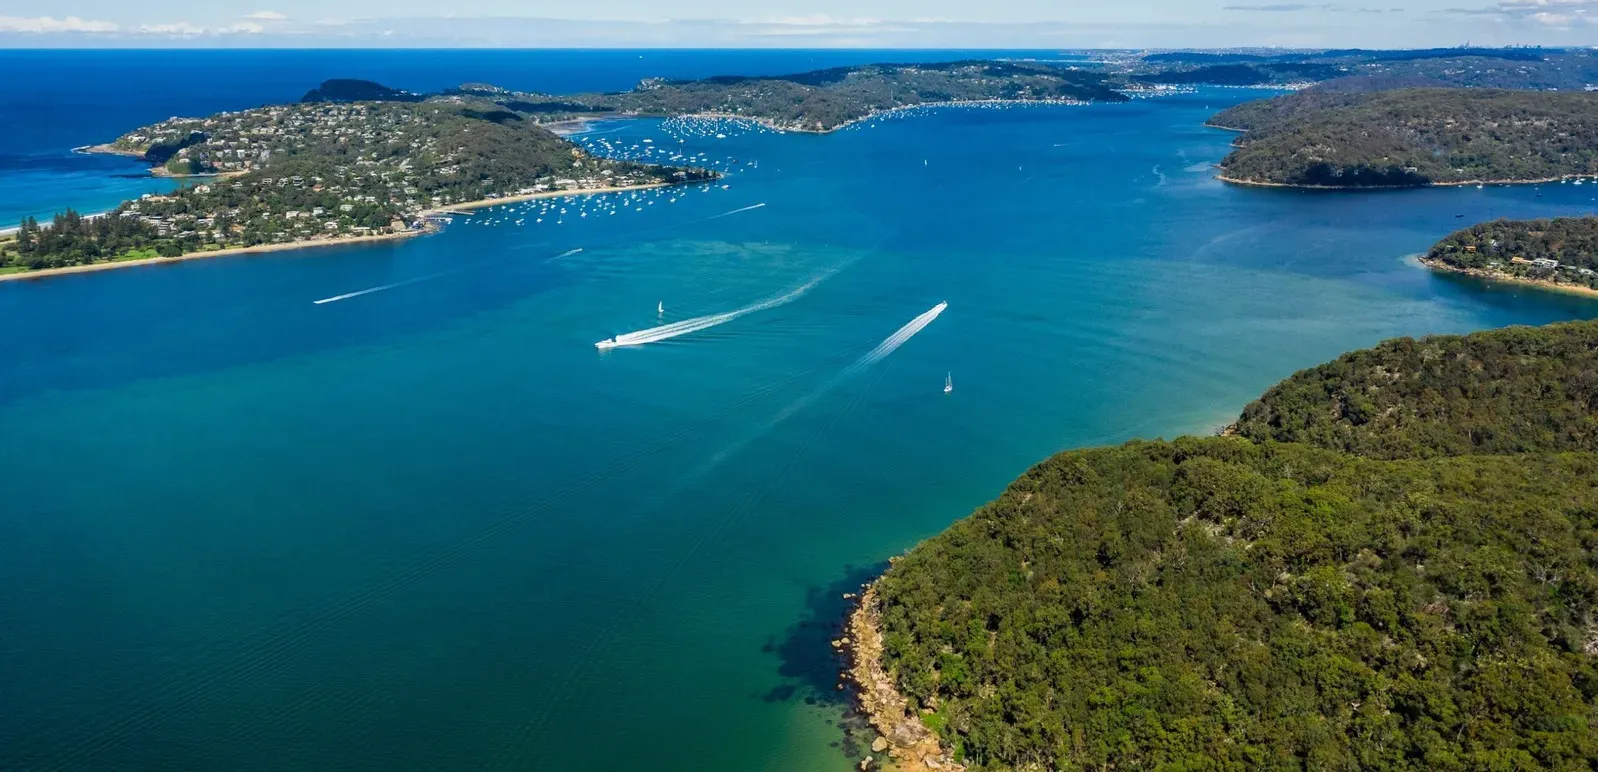
Pittwater Entrance & Bank
A deeper perspective on Sydney
Pittwater is one of Sydney’s great sheltered-water destinations, and the entrance need not be a barrier to deeper-draft yachts.
The Pittwater Bank is a navigable part of the entrance. With sound passage planning, a suitable state of tide, an understanding of the seabed and good seamanship, vessels drawing more than 3 metres may find that Pittwater is a very realistic destination.
Australian Superyachts has combined recent local soundings with NSW Government Marine LiDAR and Transport for NSW multibeam survey data to give professional captains a more detailed picture of the bank. This page brings together depth information, a 3D seabed model, clearance tools, survey charts, reference waypoints and a documented deep-draft transit to support your own assessment.
In November 2026, a 50-metre sailing superyacht drawing 4.3 metres crossed the bank on a predicted tide of 1.7 metres, recording a least depth of 5.2 metres.
The transit demonstrates the value of understanding the seabed, choosing the right conditions and applying sound seamanship.
The message is simple: do not rule out Pittwater on draft alone. Understand the bank, use the information available, assess your vessel and the conditions, and make the decision from the bridge.
This resource is intended to assist professional captains with preliminary assessment and passage planning. It is not a navigational product, a recommended route or a guarantee of safe clearance. The master remains responsible for the vessel’s passage.
Not for navigation. The bank is mobile sand and depths can change. Always use current official charts, notices and local information, and read the full disclaimer before relying on any information on this page.
The entrance at a glance
| Item | Detail |
|---|---|
| Latest sounding survey | 16 November 2026 (surveys on 5, 14 and 16 November 2026) |
| Soundings | Approximately 1,350, combined with 2018 NSW Marine LiDAR and the October 2021 Transport for NSW multibeam survey |
| Official multibeam survey | Transport for NSW survey 717-033, 25 to 29 October 2021, a strip just east of the bank leg; our 2026 soundings are within about 0.2 m of it on average (see the datum check) |
| Shallowest recorded depth on the surveyed leg | About 3.3 m below chart datum |
| Typical depth along the bank leg | About 3.5 m below chart datum |
| Bank leg | 186°T, about 975 m, BAR N to BAR S 186 |
| 4.3 m draft transit | 50 m superyacht, 4.3 m draft, 1.7 m predicted tide, about 0.9 m under the keel |
| RMYC marina, Newport | Approximately 3.5 NM from the bank; vessels to approximately 75 m LOA (confirm before arrival) |
On this page: Tide, draft and clearance · 3D model · Depth profile · GPX and KML · Contour charts · 4.3 m draft transit · Conditions · Survey method · RMYC · Support · Disclaimer
Tide, draft and clearance
Understanding the relationship between charted depth, tide and vessel draft is the starting point for assessing the Pittwater Bank.
All depths shown on this page are in metres below chart datum. To estimate static water depth, add the predicted height of tide to the charted depth. Subtract your vessel’s static draft to calculate the static clearance.
This is a preliminary calculation only. It does not establish safe under-keel clearance. The master must independently assess the effects of squat, vessel motion, swell, actual water level, survey limitations and the vessel’s operating characteristics.
Datum check, 19 November 2026. Our soundings were reduced with Mackerel Beach tide predictions. A check against water levels recorded at the Patonga tide gauge (Manly Hydraulics Laboratory) on 14 and 16 November 2026 found the water was about 0.2 m higher than the tide we applied. Referred to the official datum used by Transport for NSW (Zero Fort Denison, 0.925 m below AHD), the depths on this page may therefore be about 0.2 m shallower than shown. Until the depths on this page are replaced by the new Transport for NSW survey of the bank, which Transport for NSW has advised is planned shortly, the worked example and calculator below deduct a 0.2 m datum allowance as a separate line. This allowance is separate from the sounding uncertainty of up to 0.2 m, and it matters most if you use Bureau of Meteorology or Fort Denison tide heights.
Worked example (preliminary): the 4.3 m transit in November 2026
| Item | Value |
|---|---|
| Shoalest sounding on the bank leg, below chart datum | 3.30 m |
| Predicted tide at 0726 on the day of the transit | +1.70 m |
| Static water depth | 5.00 m |
| Vessel static draft | −4.30 m |
| Calculated static clearance over the shoalest sounding (unadjusted arithmetic) | 0.70 m |
| Less datum allowance, pending the new Transport for NSW survey | −0.20 m |
| Less sounding uncertainty | up to −0.20 m |
| Indicative static clearance after both deductions | about 0.30 m |
Preliminary. The 0.70 m figure is the unadjusted arithmetic result from the published 3.3 m sounding. The two deductions are separate matters: the datum allowance covers a possible 0.2 m offset in the tide used to reduce our soundings (see the datum check), and the sounding uncertainty covers the accuracy of the individual soundings. Both will be reviewed when the new Transport for NSW survey is published.
The 3.3 m figure is the shallowest recorded sounding on the surveyed bank leg. The typical depth along the leg is approximately 3.5 m below chart datum. During the November 2026 transit, the vessel’s sounder recorded a least depth of 5.2 m, consistent with the typical depth at the predicted tide of 1.7 m. The actual depth encountered on a vessel’s track may differ from the shallowest sounding recorded elsewhere on the surveyed leg.
Illustrative tide height required over the recorded 3.3 m sounding, by draft and chosen clearance
| Draft | 0.5 m clearance | 1.0 m clearance | 1.5 m clearance |
|---|---|---|---|
| 3.0 m | 0.2 m | 0.7 m | 1.2 m |
| 3.5 m | 0.7 m | 1.2 m | 1.7 m |
| 4.0 m | 1.2 m | 1.7 m | 2.2 m |
| 4.3 m | 1.5 m | 2.0 m | 2.5 m |
| 4.5 m | 1.7 m | 2.2 m | 2.7 m |
Tide needed = draft + chosen clearance − 3.3 m, before any deduction. Until the new survey is published, add 0.2 m to every figure for the datum allowance, and consider up to a further 0.2 m for sounding uncertainty. Higher tide heights may not be available at the required time. Check the applicable Pittwater predictions and actual conditions. The clearance columns are arithmetic examples, not recommendations, and this table does not set a maximum draft.
Pittwater Bank clearance calculator
Arithmetic aid for preliminary passage planning. Enter your static draft, the clearance margin you choose and the predicted tide at the bank.
| Static water depth (depth + tide) | – |
| Calculated static clearance under the keel | – |
| Less datum allowance (interim, pending the new Transport for NSW survey) | −0.2 m |
| Less sounding uncertainty | up to −0.2 m |
| Indicative static clearance after both deductions | – |
| Indicative clearance less your desired margin | – |
| Tide needed for your draft and margin, before deductions | – |
| Tide needed with both deductions | – |
Depth source: Australian Superyachts soundings on the bank leg, November 2026.
Enter your draft to see the figures.
Discuss your draft and timing with usThis calculator provides arithmetic assistance only. It does not include dynamic under-keel clearance, squat, vessel motion, swell, actual water level or survey uncertainty beyond the two deductions shown, and it does not determine whether a vessel can safely cross the bank. The master remains responsible. Not for navigation.
Interactive 3D seabed and static clearance model
Explore the seabed in three dimensions. Adjust the predicted tide and vessel draft to see how the available static water depth changes across the bank.
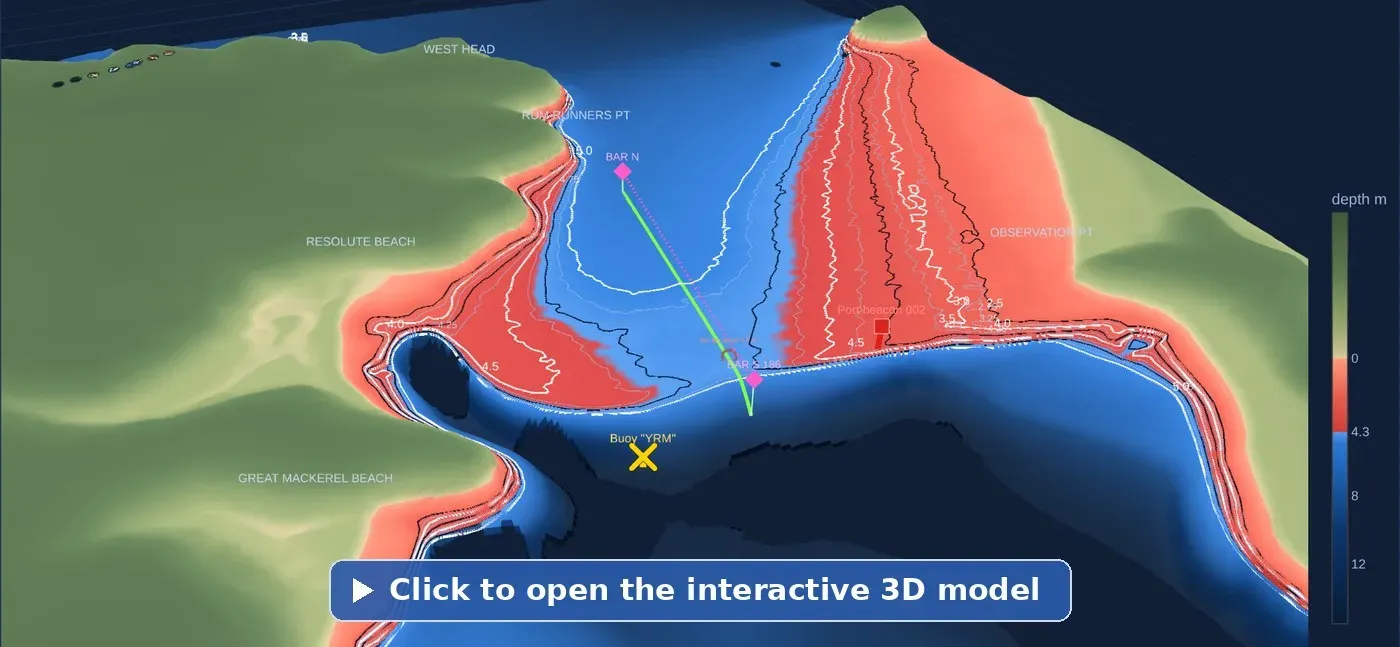
The model is a visual assessment tool, not a navigational display. It compares the modelled seabed with the water level, draft and margin you enter. It does not account for dynamic under-keel clearance, vessel motion, swell, actual water level or all survey uncertainties.
Blue does not mean safe. The model is intended to help you understand the seabed, not to determine whether your vessel can cross. Discuss your draft and timing with us.
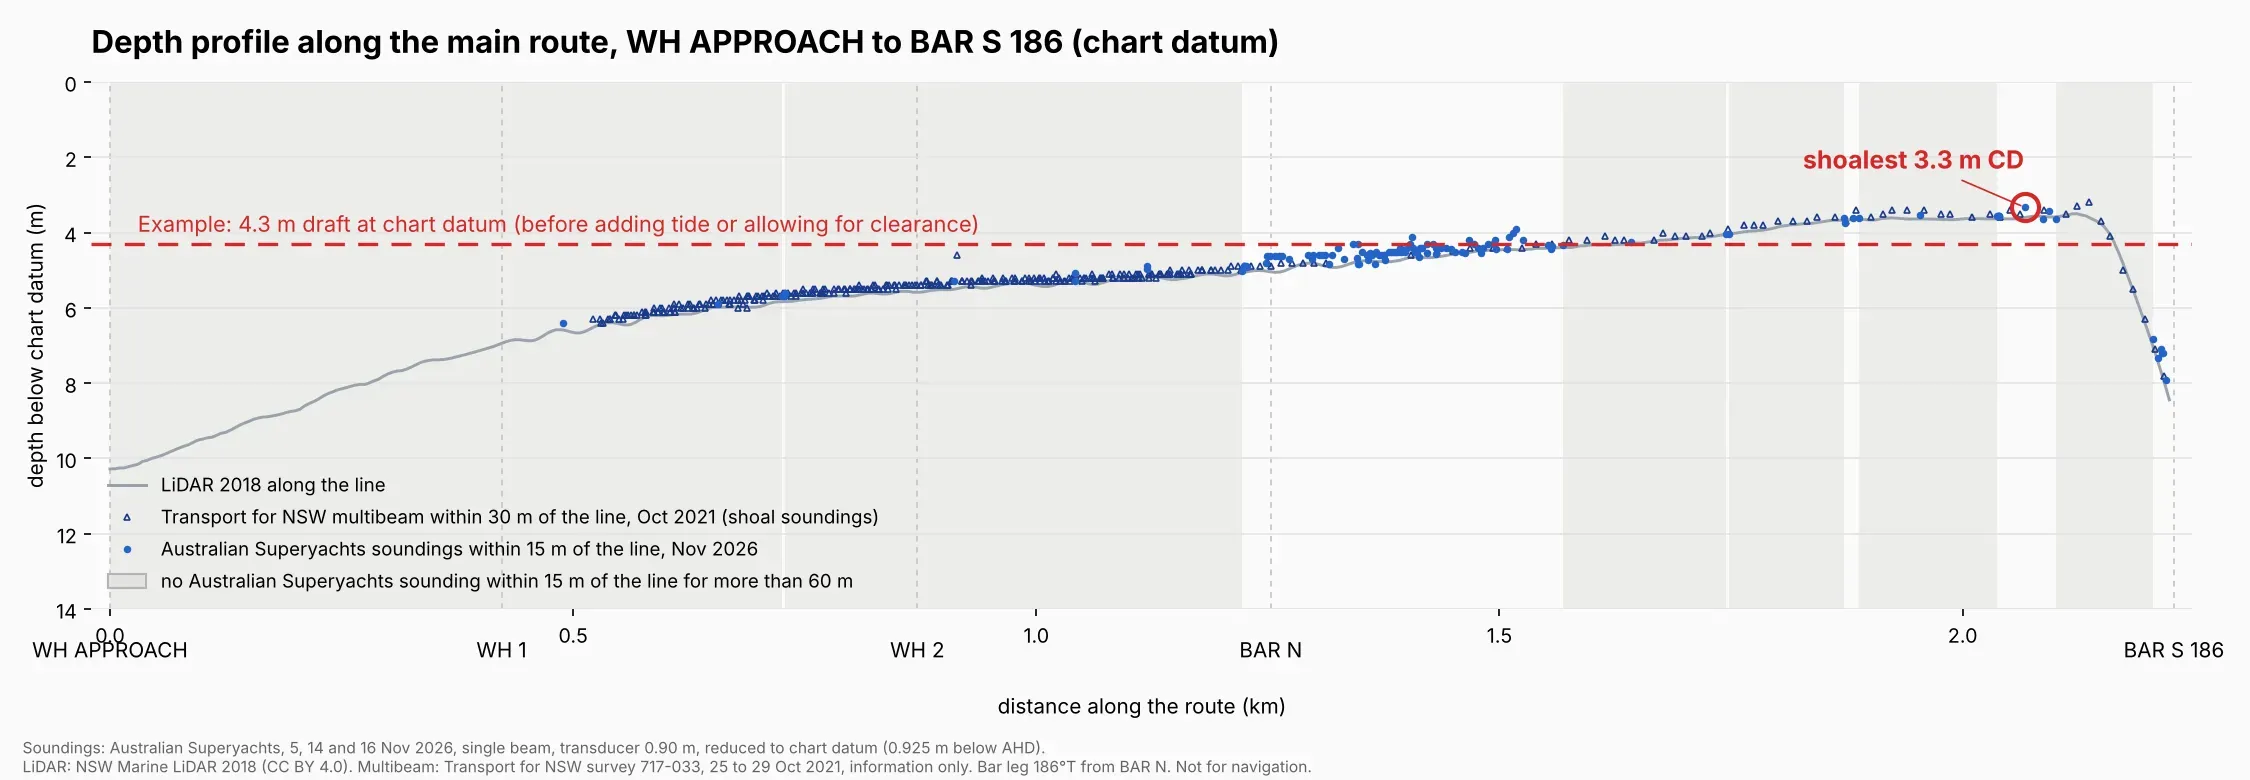
Understand the depth along the surveyed leg
This profile shows the seabed along the reference line from WH APPROACH through WH 1, WH 2 and BAR N to BAR S 186.
Blue points represent Australian Superyachts soundings recorded within 15 metres of the line. Navy triangles represent Transport for NSW multibeam soundings from October 2021 within 30 metres of the line (on the bank leg these lie 23 to 30 metres east of it). The grey profile represents the 2018 NSW Government Marine LiDAR data.
All depths are below chart datum. Add the relevant predicted tide height to estimate static water depth. The profile combines datasets of different ages and accuracy, and should be read alongside the survey methodology and limitations.
Reference waypoints, not a recommended track
The GPX and KML files identify the position of the surveyed 186°T bank leg, approximately 975 metres in length, between BAR N and BAR S 186.
They are provided as geographical references to help captains compare the surveyed area with current official charts and their own passage-planning information. They are not an authorised route, a recommended track or a navigational product.
Do not upload or follow this line as a passage route without independently verifying the vessel’s intended track, current depths, conditions and navigational requirements.
On the shallowest part of the leg the typical depth is about 3.5 m and the shallowest recorded sounding about 3.3 m below chart datum. The October 2021 Transport for NSW multibeam survey covers a strip starting about 25 m east of the leg; opposite the shallowest part of the leg it shows about 3.0 to 3.2 m at its western edge, shoaling further east, which supports keeping to the leg. Re-checked against all three data sets, the 186° leg is within about 0.05 m of the deepest straight leg we can find across the bank.
Download “Pittwater Bank Survey Reference Leg” (GPX).
GPX and KML downloads
Enter your email address to unlock the GPX and KML route files on this page.
Thank you. Your downloads are unlocked:
Edition November 2026, generated 16 November 2026. Coordinates WGS84. Waypoints: BAR N 33°35.124′S 151°18.624′E and BAR S 186 33°35.647′S 151°18.558′E. Also available as KML for Google Earth: download “Pittwater Bank Survey Reference Leg” (KML). Planning a crossing? Discuss your draft and timing with us.
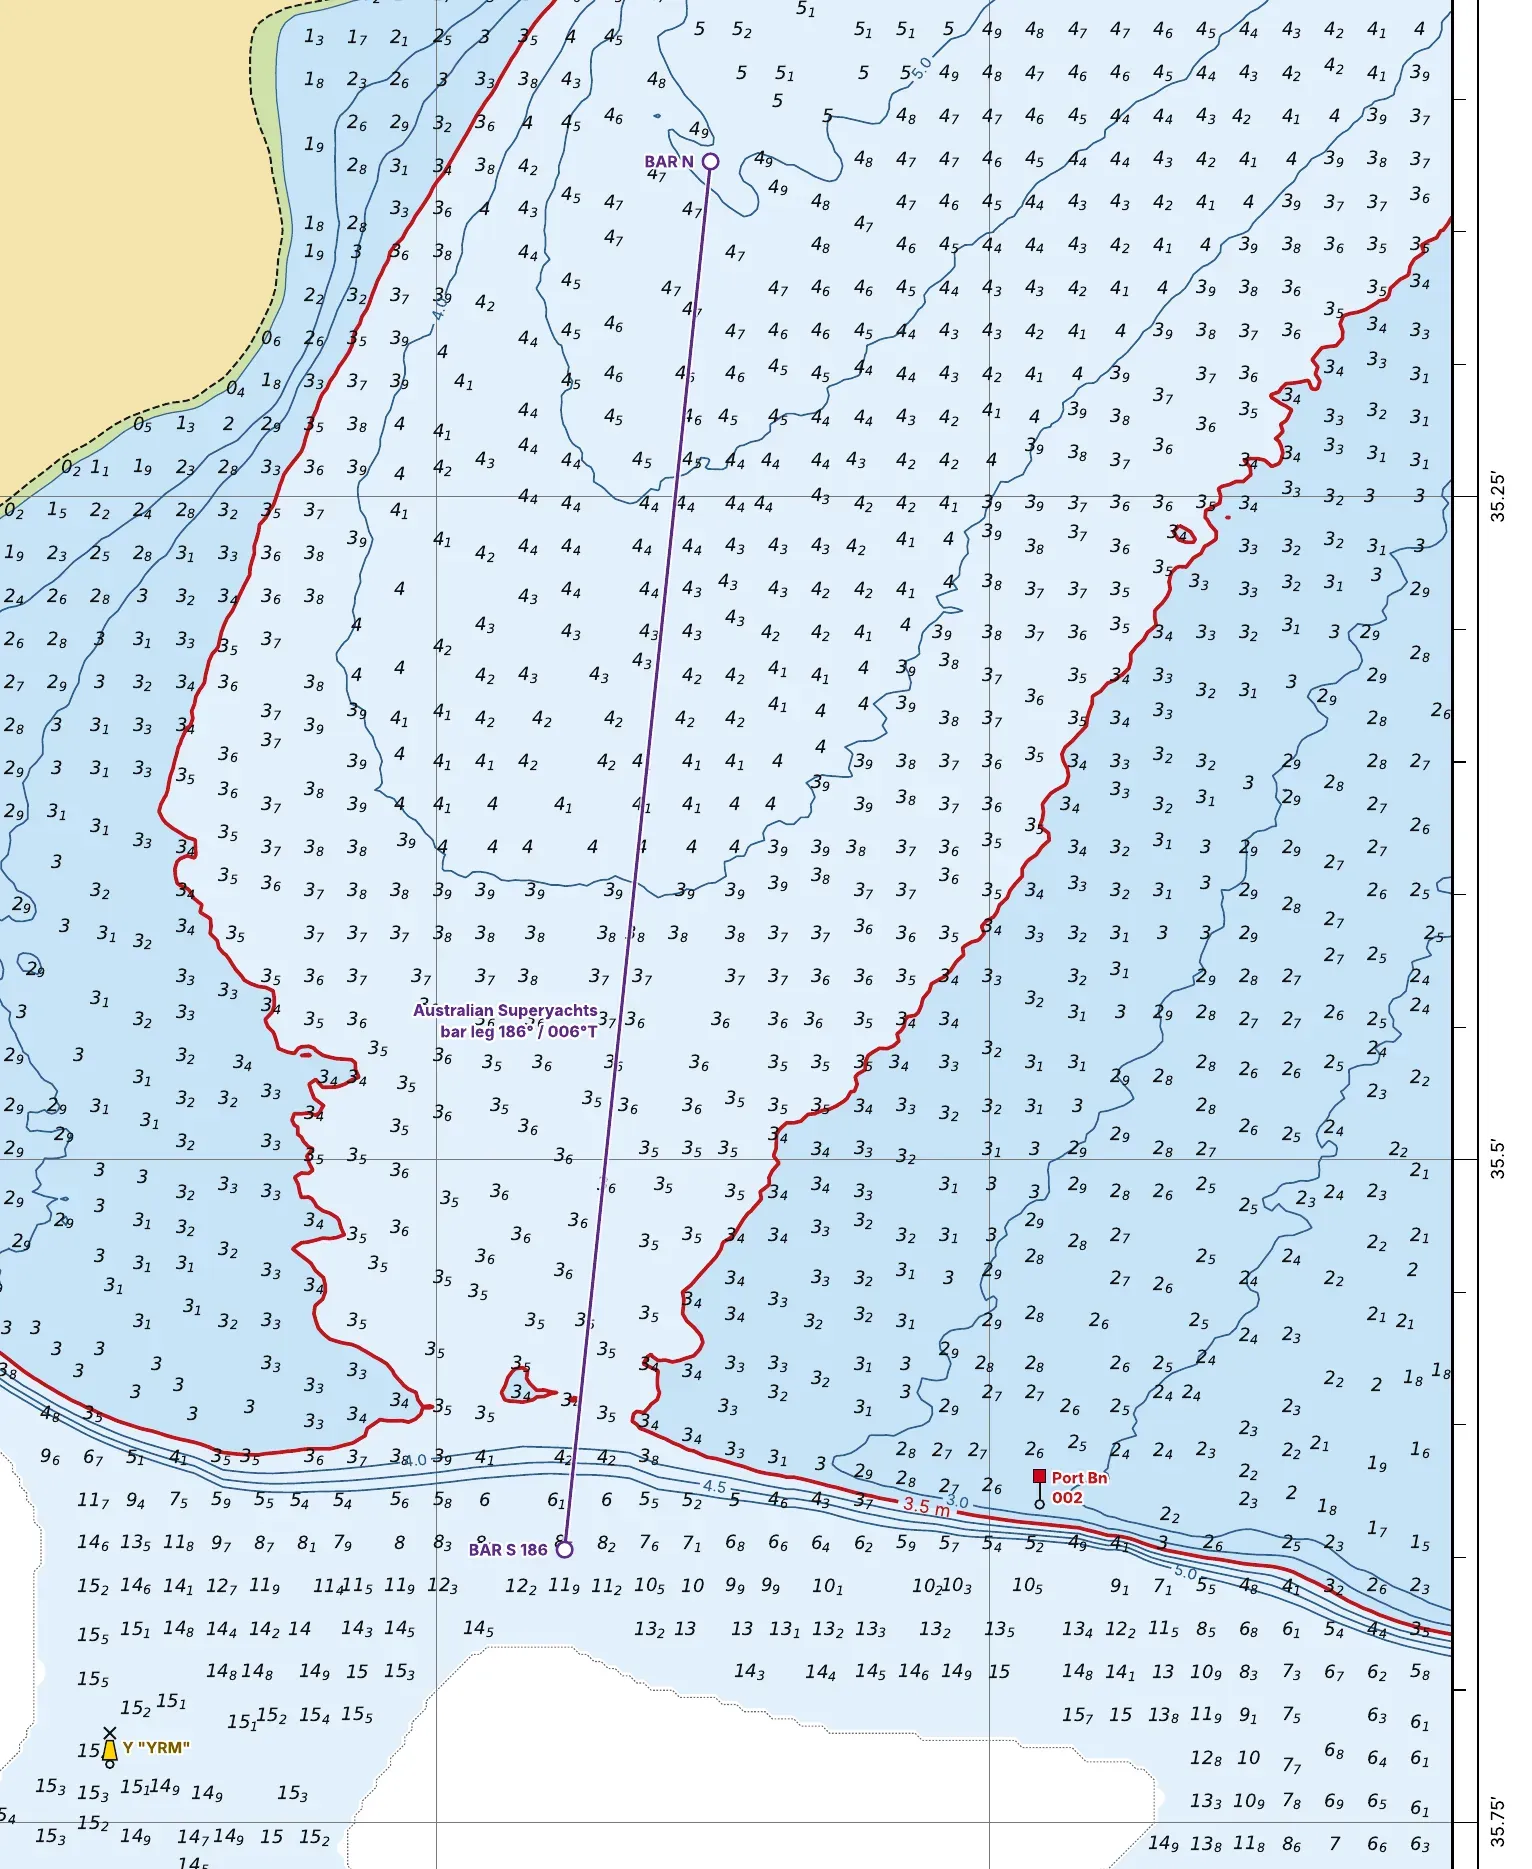
Contour charts
Each chart shows one depth contour in red, with darker blue for water at or shallower than that depth and light blue for deeper water, all at chart datum. Choose the contour closest to your draft plus your under-keel clearance, less the height of tide. A3, PDF.
Australian Superyachts soundings, November 2026, and Transport for NSW multibeam, October 2021 (contours fitted to both, edition 6):
LiDAR 2018 only (NSW Marine LiDAR soundings and contours):
A 4.3 m draft transit, November 2026
In November 2026 I brought a 50-metre superyacht drawing 4.3 metres into Pittwater. The predicted tide at the bank was 1.7 metres at 0726. The swell was non-existent and the wind light and variable. We crossed at 6 knots on the 186° leg. The least depth we saw on the sounder was 5.2 metres, giving about 0.9 metres under the keel.
It was a planned crossing: chosen tide, calm conditions and local knowledge on the bridge. It shows the entrance should not be dismissed on draft alone. It does not mean every 4.3 metre yacht can cross on every 1.7 metre tide.
Captain Richard Morris, Australian Superyachts
Conditions matter as much as depth
The Pittwater Bank is a submerged sand feature across the entrance to Pittwater. Unlike a conventional shallow coastal bar, the bank does not break. Its depth and the attenuation of offshore swell mean that breaking seas are not a feature of this crossing.
Nevertheless, conditions remain an important part of any passage assessment. Wind, residual swell, current, visibility, tide and the vessel’s manoeuvring characteristics should all be considered before committing to the crossing.
Captains should assess the latest local conditions and tide predictions, consider the vessel’s static and dynamic under-keel clearance requirements, and determine an appropriate speed having regard to steerage, manoeuvrability and squat.
The absence of breaking waves does not remove the need for careful passage planning. The master remains responsible for assessing the vessel, the available depth information and the conditions prevailing at the time of transit.
The bank leg also crosses the south-west corner of the charted seaplane landing area off Palm Beach. Maintain a proper lookout for seaplanes.
- Bureau of Meteorology NSW tide tables
- Transport for NSW: navigating coastal bars
- Transport for NSW: coastal bar webcams
If in doubt, call us before you commit: +61 416 486 782.
Survey method and accuracy
How the information was assembled
Australian Superyachts conducted three sounding surveys across the Pittwater Bank in November 2026. Approximately 1,350 soundings were recorded and reduced to chart datum, then considered alongside NSW Government Marine LiDAR data from 2018 and the Transport for NSW multibeam survey of October 2021.
The resulting charts and model combine recent vessel soundings with the older LiDAR surface and, in a strip east of the bank leg, the 2021 multibeam survey. The coverage is not uniform, and the shallowest part of the bank has less direct sounding coverage than other areas. The source and limitations of each dataset are explained below.
Accuracy at a glance. Our soundings: approximately ±0.1 to 0.2 m. 2018 NSW Marine LiDAR: about ±0.5 m vertical (IHO Order 1b, as stated for the LiDAR survey). Between our survey lines the charts use the 2021 Transport for NSW multibeam where it exists and the LiDAR elsewhere. Our sounding coverage is thinnest on the shallowest part of the bank leg, shown shaded grey on the depth profile, so depths there lean more on the LiDAR.
Fort Denison and Pittwater tides. For reduction of the November 2026 survey soundings, Mackerel Beach predicted tide heights were adjusted using the observed tide residual at Fort Denison on the relevant day. This adjustment was used in processing the survey data. It is not a substitute for checking current Pittwater tide predictions and actual water levels when assessing a proposed transit.
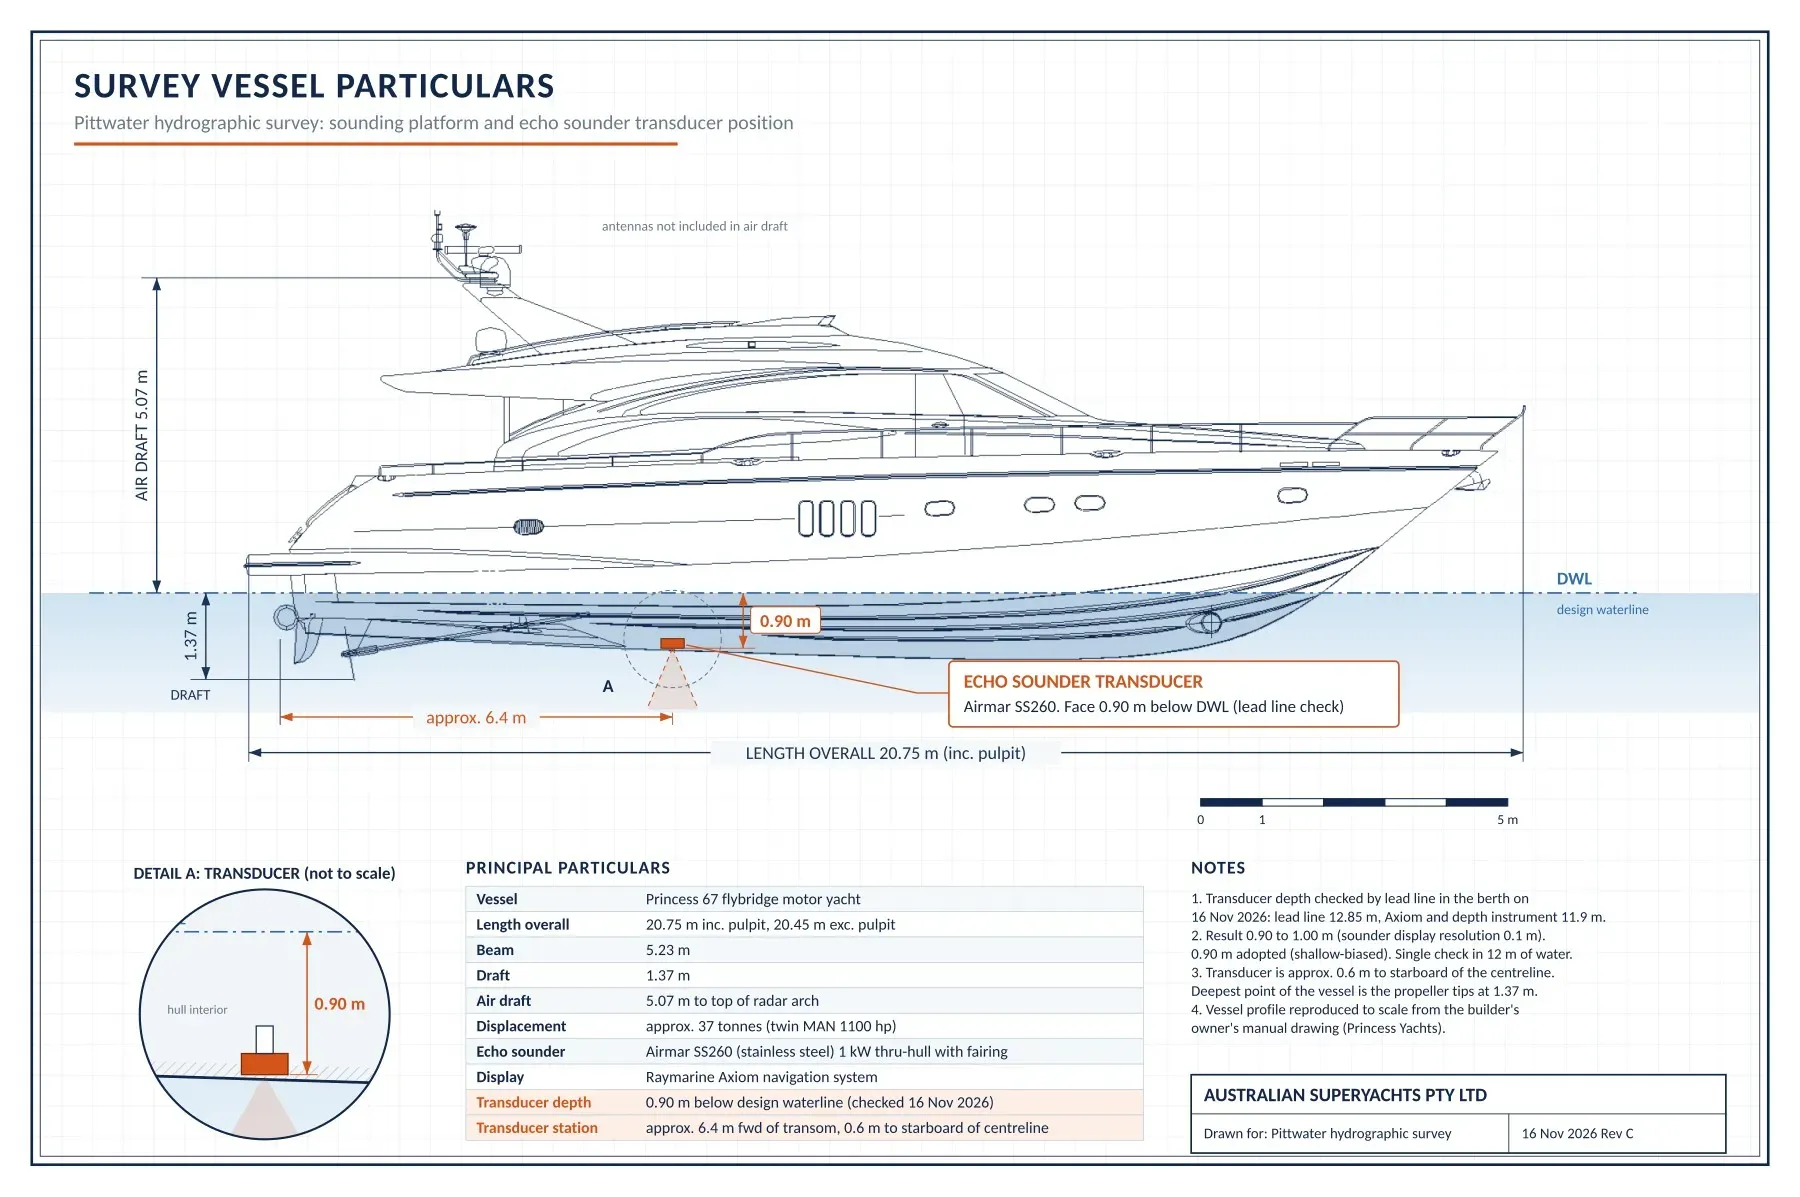
The soundings on this page were taken by Australian Superyachts from a Princess 67 motor yacht fitted with an Airmar SS260 through-hull transducer and a Raymarine Axiom display. Three surveys were run across the bank on 5, 14 and 16 November 2026, giving approximately 1,350 soundings, each read with its GPS position and time from photographs of the chartplotter screen.
- Transducer depth: 0.90 m below the waterline, checked by lead line on 16 November 2026 (lead line 12.85 m against a sounder reading of 11.9 m, giving 0.90 to 1.00 m; 0.90 m adopted, which is the conservative choice).
- Reduction to chart datum: depth = sounder reading + 0.90 m transducer depth, minus the tide height at the time of the sounding. Tide heights are the Mackerel Beach predictions, adjusted by the observed tide residual (observed minus predicted) at Fort Denison on the day.
- Datum: chart datum is taken as 0.925 m below AHD (Australian Height Datum), the value used to convert the NSW Government LiDAR to chart datum.
- Accuracy: we estimate individual soundings are good to approximately ±0.1 to 0.2 m. Our soundings read on average about 0.1 m shallower than the NSW LiDAR at the same positions. Between our survey lines the charts use the 2021 Transport for NSW multibeam where it exists and the LiDAR elsewhere.
Transport for NSW multibeam survey, October 2021. In November 2026 Transport for NSW (NSW Maritime) provided its most recent hydrographic survey of the entrance: survey 717-033, Pittwater Monitoring, sounded 25 to 29 October 2021 with a Reson T50 multibeam echo sounder, with RTK GNSS positions and tides. Its soundings are reduced to Zero Fort Denison Tide Gauge, 0.925 m below AHD, the same chart datum used on this page. It covers a strip about 250 m wide from off West Head south across the bank, starting about 25 m east of our bank leg, and then east to Palm Beach ferry wharf. We read approximately 4,800 soundings from the published plan (shoal soundings selected by Transport for NSW from a 1 m grid). The 2021 multibeam reads on average 0.14 m shallower than the 2018 LiDAR, and our 2026 soundings within 5 m of a 2021 multibeam sounding are within about 0.2 m of it on average (242 pairs, spread about 0.25 m). As first reduced they agreed to within a few centimetres; referred to the water levels recorded at Patonga they read about 0.2 m shallower than the 2021 survey (see the datum check). The contour charts, depth profile and 3D model now include it. Transport for NSW makes the plan available for information purposes only and makes no warranty about its accuracy, reliability or completeness. Transport for NSW has advised that a new survey is planned within weeks; once it is published on its Hydrographic plans page we will update this resource.
This is not a certified hydrographic survey. The seabed on an open-coast bank moves with storms and swell, so depths can change between surveys.
Survey and review log
| Date | Activity |
|---|---|
| 19 November 2026 | Pittwater chart and reference route from sea to RMYC added; datum check against water levels recorded at Patonga |
| 17 November 2026 | Transport for NSW multibeam survey 717-033 (October 2021) added to the contour charts, depth profile and 3D model |
| 16 November 2026 | Page published |
| 5, 14 and 16 November 2026 | Sounding surveys, approximately 1,350 soundings |
Beyond the bank: discover Pittwater
Once inside, the character of the coastline changes. Pittwater is a magnificent sheltered waterway, framed by the bushland of Ku-ring-gai Chase National Park and the Northern Beaches.
Its protected anchorages, beautiful shoreline and access to the Hawkesbury River offer visiting yachts a very different experience of Sydney. For captains and owners looking beyond the busier harbour, Pittwater is a destination well worth considering.
A Pittwater base at Royal Motor Yacht Club, Newport
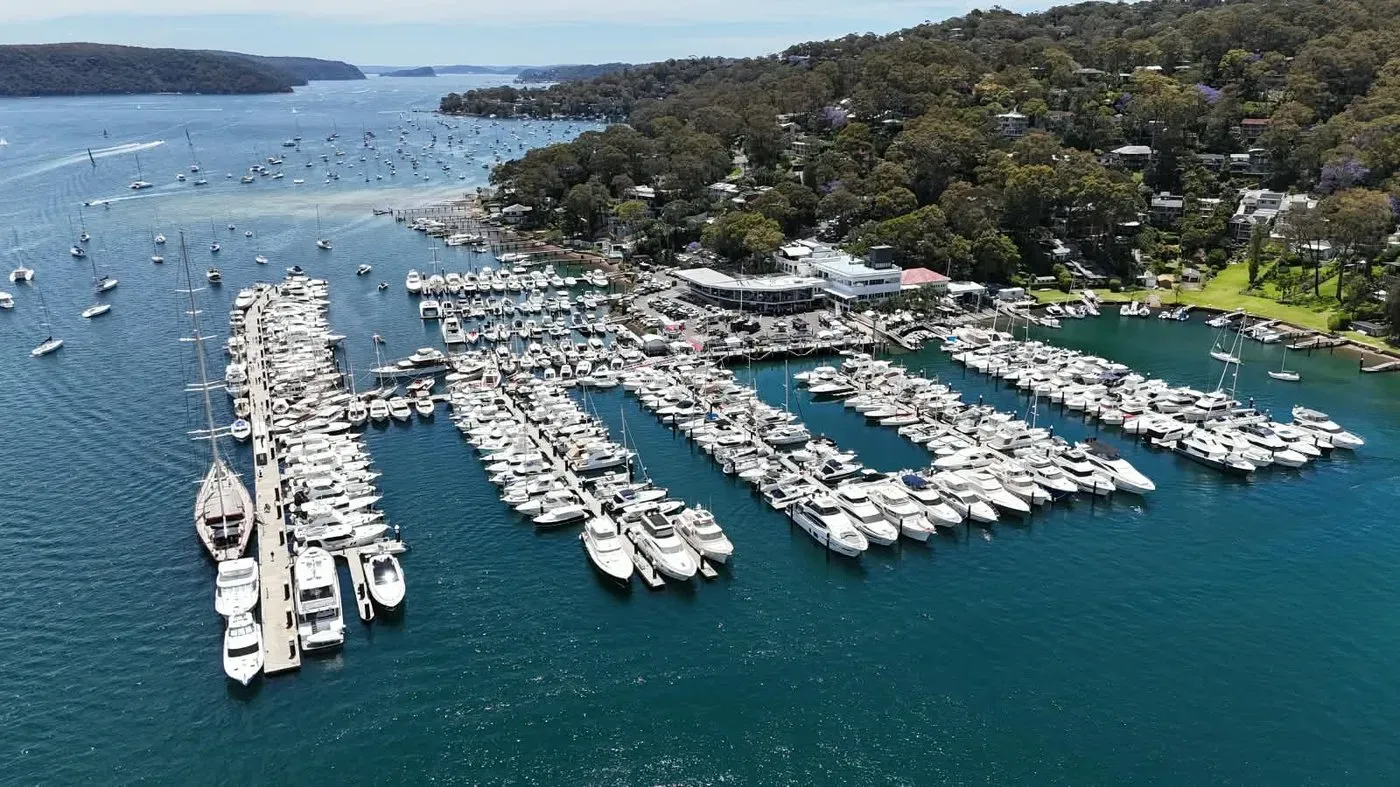
Approximately 3.5 nautical miles south of the entrance, the Royal Motor Yacht Club Broken Bay at Newport provides a convenient base from which to enjoy Pittwater and the surrounding region.
The marina has substantial water alongside and may accommodate visiting superyachts of significant length, subject to berth availability and confirmation of the vessel’s dimensions and requirements.
Australian Superyachts is based at the Club and can assist with berth enquiries and the arrangements required for a Pittwater visit.
- Depth alongside: approximately 12 metres
- Maximum length: 75 metres
- Location: 46 Prince Alfred Parade, Newport, on the eastern shore of Pittwater just south of Salt Pan Point
Berth figures are approximate. Please confirm availability and your vessel’s requirements with us before arrival.
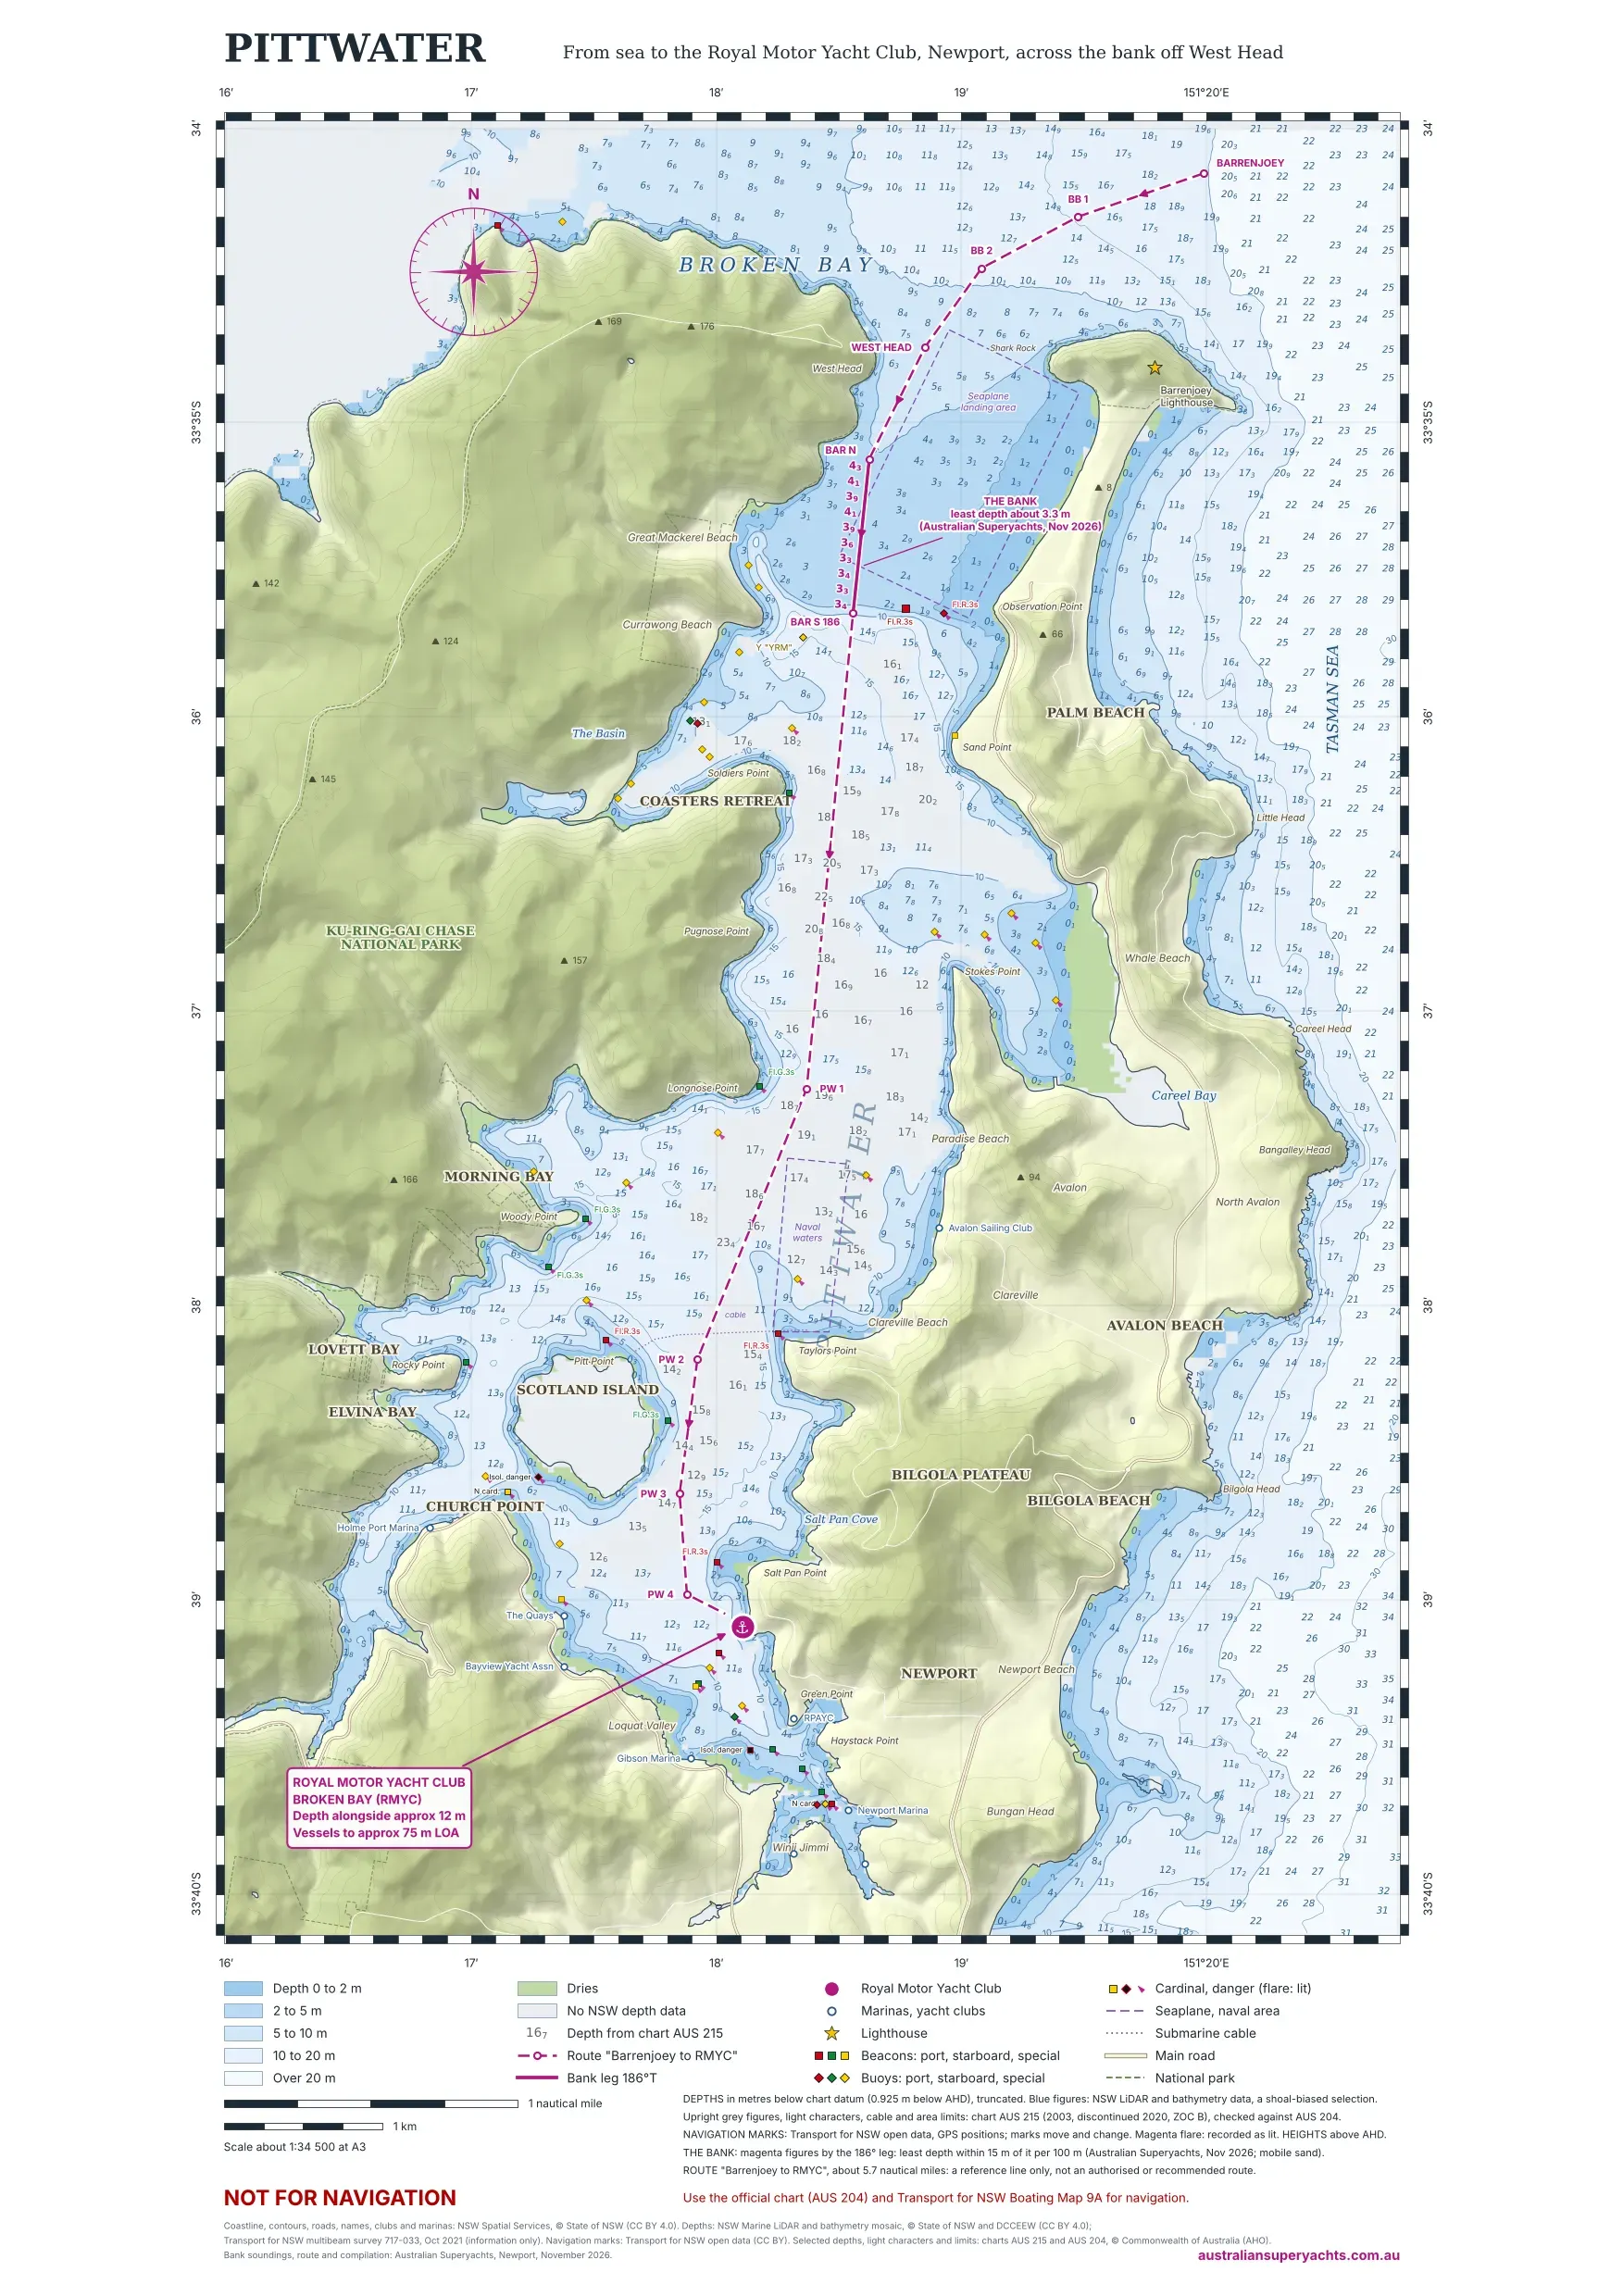
Depths on the chart are from NSW Government LiDAR and bathymetry data, with the bank from our own soundings and the Transport for NSW 2021 multibeam survey. In the deep central channel, where the NSW data has no coverage, the upright grey figures are from chart AUS 215 (published 2003, discontinued 2020), checked against the current chart AUS 204. Beacons and buoys are from Transport for NSW open data and may have moved or changed. The light characters, the seaplane landing area off Palm Beach, the naval waters off Clareville and the submarine cable are from the same charts and may have changed. The dashed line is a reference route of about 5.7 nautical miles from sea to RMYC, not an authorised or recommended route. For navigation use the official chart (AUS 204) and the Transport for NSW boating map.
Download the route “Barrenjoey to RMYC” (GPX). Eleven waypoints, about 5.7 nautical miles, from about 1 km north of Barrenjoey Head, across the bank on the 186° leg (BAR N to BAR S 186), to the RMYC marina. Also available as KML for Google Earth: download the route (KML).
The route files identify the geographical position of a reference line for desktop examination and comparison with official chart information. Least depth is about 3.3 m below chart datum on the bank leg. South of the bank the line follows charted depths of about 9 m or more, taken partly from charts AUS 215 and AUS 204 where NSW survey data has no coverage. It is not an authorised navigational route or a recommended track, and it must not be relied upon for navigation or substituted for current official charts, notices and independent passage planning. Edition November 2026. Coordinates WGS84.
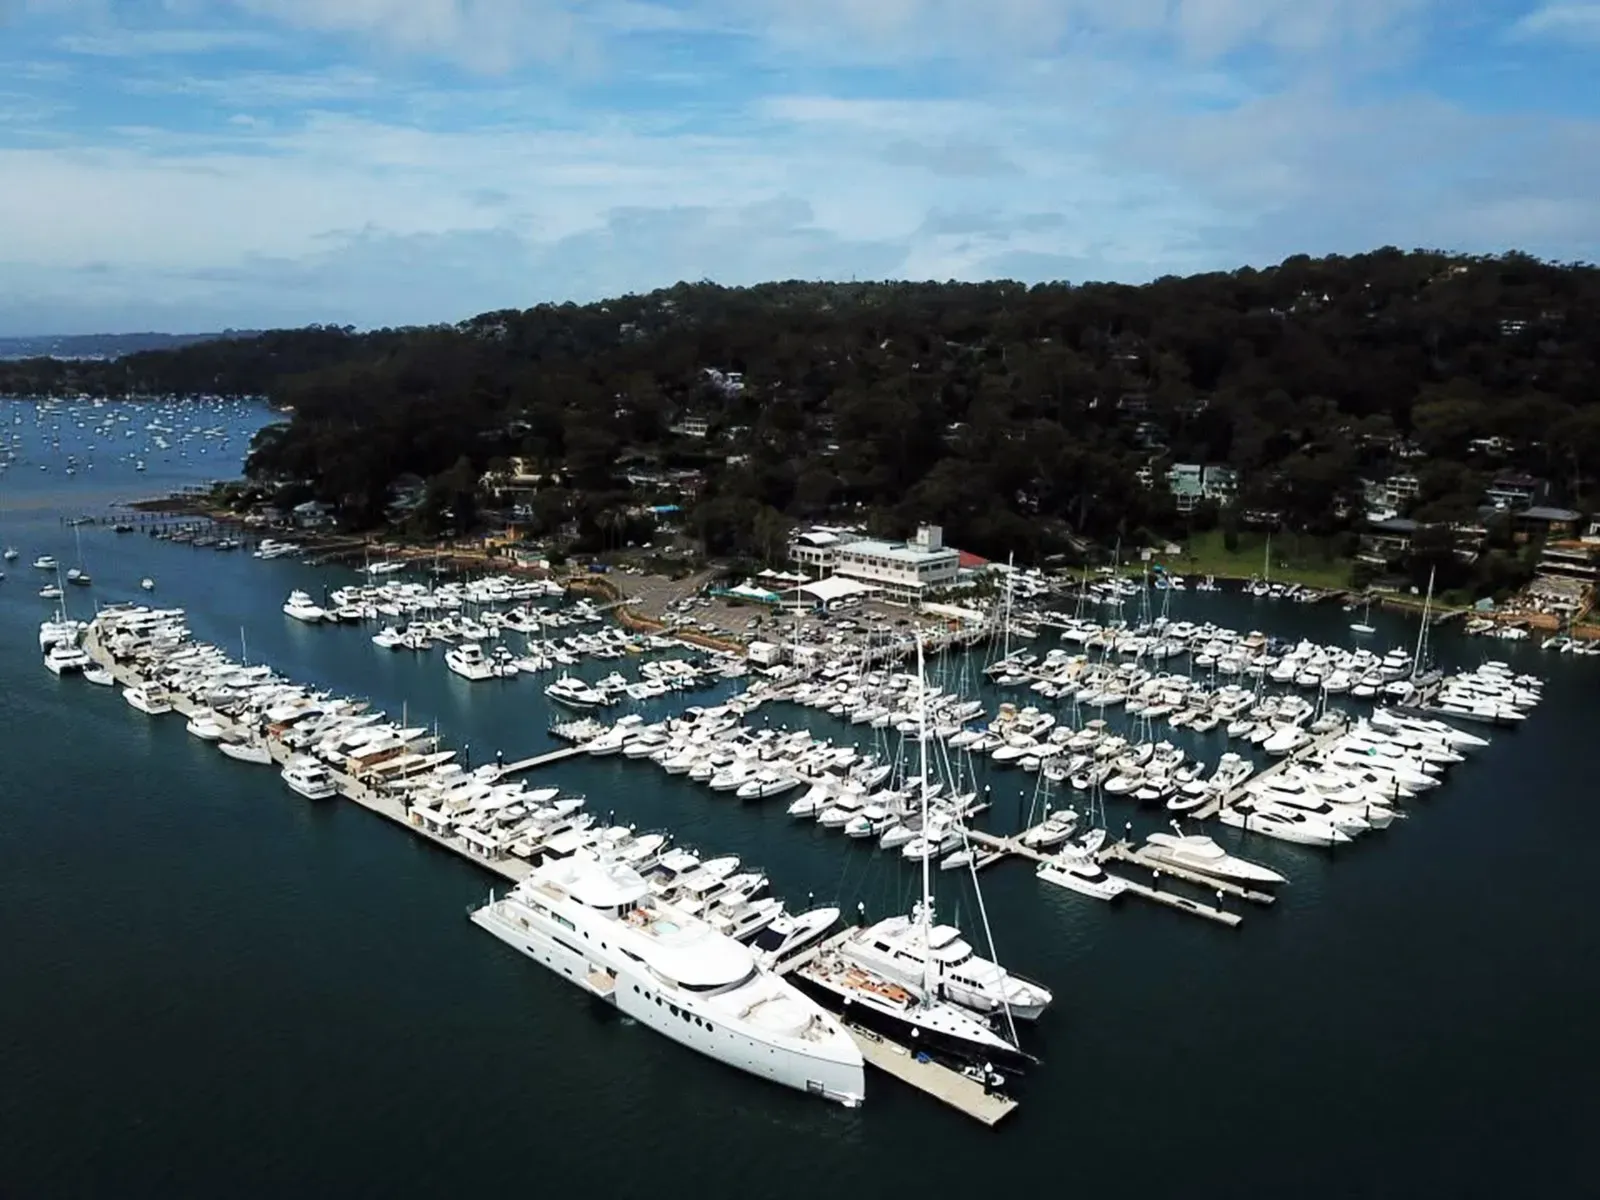
Berth suitability is confirmed against LOA, beam, draft and availability.
Pittwater boating map (Transport for NSW)
Download Boating Map 9A, Pittwater, from Transport for NSW (PDF, 2.4 MB)
Map 9A shows speed limits, no-wash zones, moorings, navigation aids and other rules for Pittwater. Published by Transport for NSW, © State of New South Wales. The link goes to the official NSW Government copy. All NSW boating maps are listed on the NSW boating maps page, where you can check for the latest edition.
Make Pittwater part of your Australian itinerary
Considering a visit to Pittwater with a deeper-draft yacht? Australian Superyachts can help you assess the available information and coordinate the practical arrangements for your arrival.
Drawing on local maritime experience and our base at Royal Motor Yacht Club, we can assist with preliminary vessel-specific tide and clearance assessments, current local information, berth enquiries, customs, immigration and biosecurity arrangements, provisioning and local contractors.
Send us your vessel’s LOA, beam, draft and proposed arrival window. We can help you establish whether Pittwater warrants further assessment for your vessel.
Soundings, analysis and model by Captain Richard Morris, AMSA Unlimited Master Mariner and Managing Director of Australian Superyachts, Newport. Australian Superyachts has supported more than 300 superyachts in Australian waters since 1999.
Disclaimer
Not for navigation. This information is published by Australian Superyachts Pty Ltd for general information and preliminary assessment of the Pittwater entrance only. It is not a nautical chart, navigational product, approved passage-planning document or recommended route. It has not been produced, checked or endorsed by the Australian Hydrographic Office, Transport for NSW or any other hydrographic or maritime authority. It must not be used for navigation.
- Survey data. The soundings were collected by Australian Superyachts from a single vessel with a recreational echo sounder in November 2026, and positions and depths were read from photographs of the chartplotter. The background seabed is from LiDAR surveyed in 2018 and, in a strip east of the bank leg, from the Transport for NSW multibeam survey of October 2021, which Transport for NSW makes available for information purposes only without warranty. All may contain errors, the data are of different ages, and areas between the survey lines were not sounded.
- The seabed changes. The bank is mobile sand. Storms, swell, currents and floods move it, and depths may already differ from those shown.
- Tides are predictions. The actual water level can differ, sometimes by a large amount, from predicted tides because of atmospheric pressure, wind, storm surge, swell, rainfall and runoff, and other weather and ocean conditions. These variations are not recorded or allowed for here.
- No allowances are made for squat, heel, pitch and roll, waves and swell, changes in draft with loading, or instrument and position error. Users must make their own allowances and keep an adequate under-keel clearance.
- Good seamanship comes first. This information does not replace official charts and notices, current local knowledge, a proper lookout, your own depth sounder, or the judgement of the skipper. The skipper or master is solely responsible for the safety of the vessel, its crew and passengers. If in doubt, do not cross.
- Use at your own risk. To the maximum extent permitted by law, Australian Superyachts and its directors, employees and contractors make no warranty that this information is accurate, complete or current, and accept no liability for any loss, damage, injury or death arising from its use or from reliance on it, whether in negligence or otherwise. Nothing in this disclaimer excludes any right that cannot be excluded under the Australian Consumer Law.
By using this information you accept these terms.
LiDAR data © State Government of NSW and NSW Department of Climate Change, Energy, the Environment and Water 2019, licensed under CC BY 4.0. Multibeam soundings: Transport for NSW (NSW Maritime) hydrographic survey 717-033, 25 to 29 October 2021, made available for information purposes only. Coastline, contours, roads and place names on the Pittwater chart: NSW Spatial Services, © State of New South Wales. Navigation marks on the Pittwater chart: Transport for NSW open data (CC BY). Selected depths, light characters and area limits on the Pittwater chart: charts AUS 215 and AUS 204, © Commonwealth of Australia (Australian Hydrographic Office). Soundings, charts and model: Australian Superyachts, November 2026.